Introduction
Understanding the Graph Model
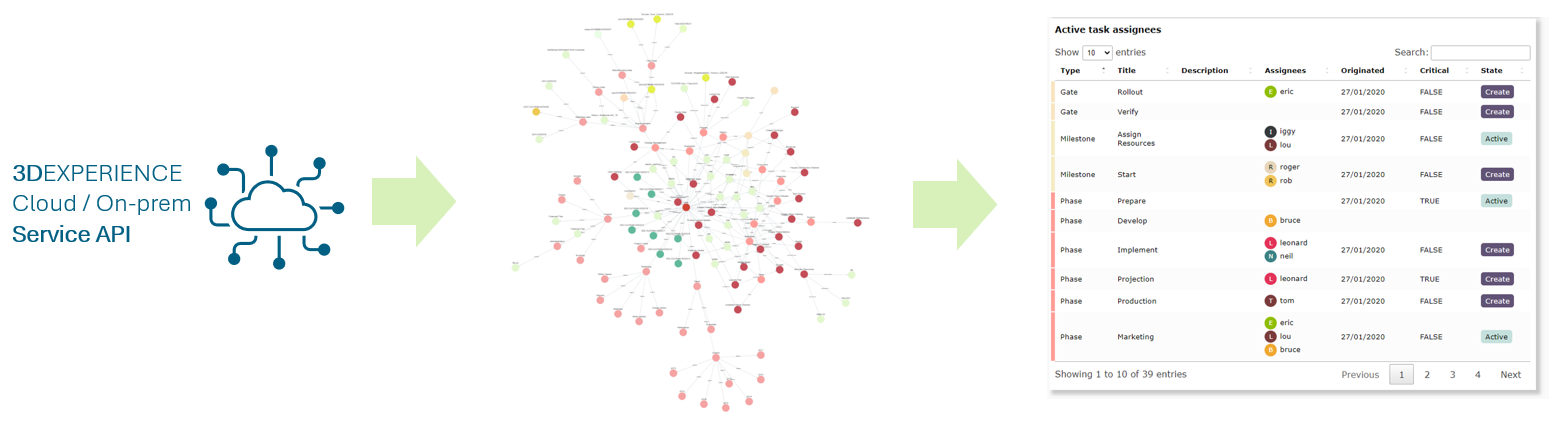
Widgetbox centralizes data from various services into a single, client side, normalized and in-memory data graph. The user interface components (like tables, forms, and charts) then pull the necessary information directly from this data store using flexible query statements and configurations. This design ensures a standardized and compact way to configure widgets, as the UI is independent of specific service details. Furthermore, because all components draw from and update this shared data store, changes made in one part of your widget application are instantly reflected across all other related components.
Cytoscape.js
https://js.cytoscape.org/ , a "Graph theory (network) library for visualisation and analysis," is used as the data store. Its graph capabilities enable complex data selection and structure traversal, similar to MQL (Matrix Query Language) in 3DEXPERIENCE.
- Selectors: cytoscape.js#selectors are similar to CSS selectors and are used extensively in configurations for data filtering.
- Headless Mode: Normally, Cytoscape runs in headless mode without visualizations.
- Visual Graphs: Visual graphs can be enabled in development mode, providing a live view of the data store, though this comes with a performance cost.
- Developer Console: Developers can query the data store graph directly using the browser's developer console.
Data store
The client (browser) data store is an in-memory, temporary storage. Its purpose is to:
- Track cross-component state.
- Provide data to the UI rendering.
- Offer a common format to avoid direct service dependency in configuration.
This data store is similar to concepts found in modern UI frameworks (e.g., Redux ) and should not be confused with a persistent database.
Nomenclature
| Word | Meaning |
|---|---|
| nodes | objects |
| edges | relationships |
| eles | a collection of edges and/or nodes |